|

Piecewise Functions
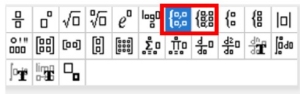
Entering piecewise functions will utilize the 7th and 8th entries in the first row of the  template. template.
The 7th option,  , allows for exactly 2 "pieces" for the function, while the 8th option, , allows for exactly 2 "pieces" for the function, while the 8th option, , allows for any number of "pieces" you want the function to have. , allows for any number of "pieces" you want the function to have.
|
Working on a "Calculator" Page (  ): Example 1:
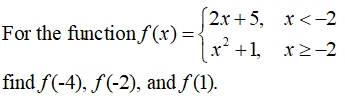
DIRECTIONS:
Since we want to evaluate the function at several locations, we will use the ":="
option (above the key) which creates a custom ("remembered") function that allows us to quickly enter different inputs into the function simply by referencing its name f (x).. |
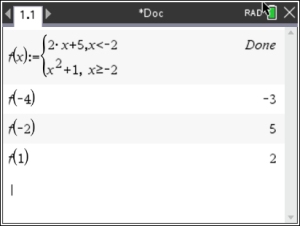
• Type f (x) := and then access the template, , choosing the " exactly two pieces" option.
• Enter the two functions with their domains.
Access the inequalities using the template above the  key. key.
• Hit  You will see "done" telling you the function has been stored for future use. You will see "done" telling you the function has been stored for future use.
• Now, type in the f (-4), f (-2) and f (1), hitting after each entry.
NOTE:
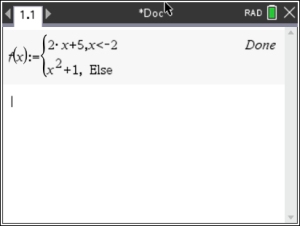
This means that the last box is NOT a mandatory box. You can leave this last box empty. If you do, the calculator will assume that you want "ALL OTHER POSSIBLE x-values for the domain of the last piece. When you hit you will see the word "Else" has been placed in the empty box. |
|
|

|
Example 2: 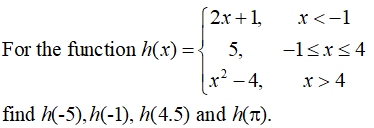
DIRECTIONS:
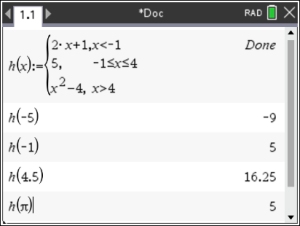
• Follow the same procedures as discussed above.
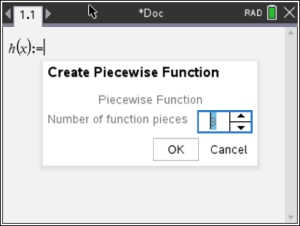
• Only this time, choose the template that will allow for 3 or more "pieces" to the function.
• This time you will have the option to set the number of "pieces" needed for the function.
The default is 3 "pieces".
|
|
Working on a "Graph" Page: (  )
|
Example 3: 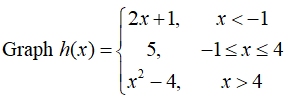
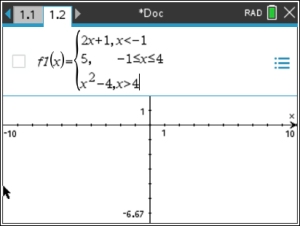
• Using the piecewise templates, enter the "pieces" directly into the function's listing for graphing.
• Hit .
Things to remember about this graph:
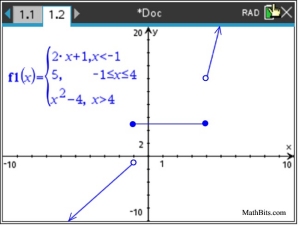
When the function is discontinuous (has breaks), as this function does, the calculator will not graph the open and closed circles needed to identify what is occurring at the break points.
* The open and closed circles seen in the graph at the right were added to the graph (by hand) after the calculator did its graphing.
The calculator, however, can show you in the tables where the endpoint values reside (or in a "trace"). |
|

Table of Contents | MathBits.com | Terms of Use
|