Examine End Behavior
| Use the TABLE feature to investigate the end behavior of a graph. |
|||
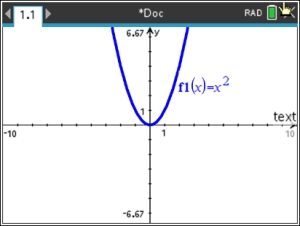
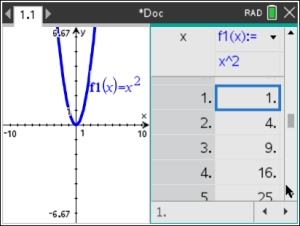
• Graph the function you wish to investigate. • Create a TABLE for the function. Press
We will be using the TABLE to examine extremely large and/or extremely small y-values from this graph. From examination of the graph, we can see that the graph "appears" to be getting larger as x →
∞, and also larger as x →
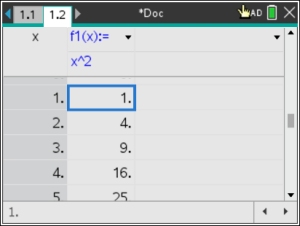
-∞. • Let's show that these "appearances" are actually true by examining the table. After you have created a split-screen Table, you can force the Table to be placed in single full screen mode by pressing
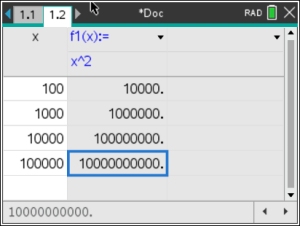
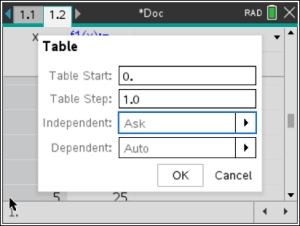
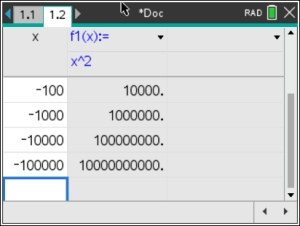
Notice that the full screen table appears on page 1.2, • To control the TABLE setup within the table: press Change the "Independent:" to ASK. • Choose very large values in both the positive and negative directions. The end behavior seen on the graph is supported!
|
Check as x → -∞.
|
||
 #7 Table,
#1 Split-screen Table
#7 Table,
#1 Split-screen Table
 Shortcut:
  -
- Full screen: