Graphing Continuous vs Discrete Functions
Graphing Continuous vs Discrete Functions
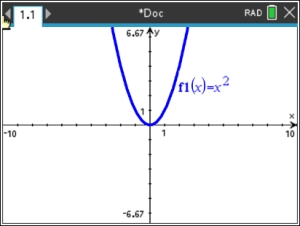
A continuous function allows the x-values to be ANY points in the interval, including fractions, decimals, and irrational values. |
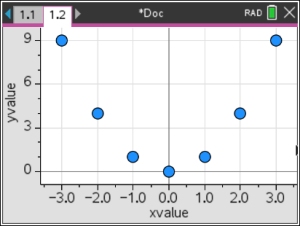
A discrete function allows the x-values to be only certain points in the interval, usually only integers or whole numbers.: |
Graph the continuous function: •
Notice that all of the visible points are connected with a continual drawing. |
Graph the discrete function: • It is not possible to graph a discrete function using f1(x).
Notice that only the integer values are plotted. The points are NOT connected. |

Table of Contents | MathBits.com | Terms of Use
 - New - 2. Graphs - Add Graph
 and choose
  for Data & Statistics,