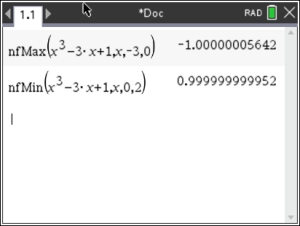
Method 2: (Graphical Trace)
•  
• Enter function into f1(x). 
•  , #5: Trace, #1, Graph Trace , #5: Trace, #1, Graph Trace
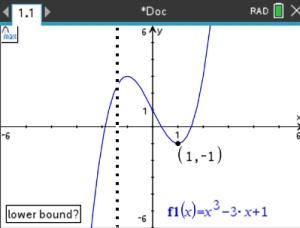
• Using left and right arrow keys, move cursor along the graph.
A spider looking icon will move along the graph when using the left and right arrows.
•
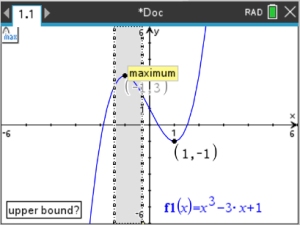
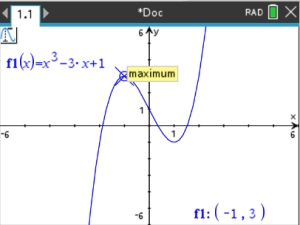
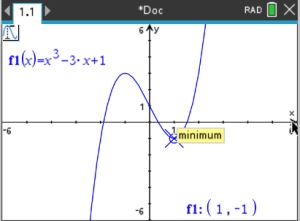
As you approach a peak or valley, the calculator will automatically grab the "special" point and display a yellow highlighted maximum or a highlighted minimum near the point, with the coordinates showing in the lower right corner of the screen.
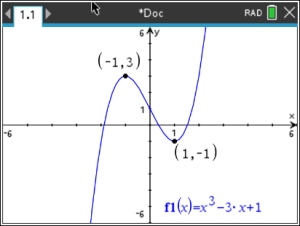
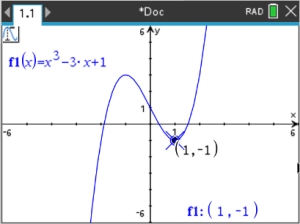
• If you want the coordinates placed on the max or min,
hit when you find the max or min.
•
Maximum: (-1,3)
Minimum: (1,-1)
• To exit the Trace tool, hit  (escape). (escape).
|


 (Calculator Page)