Step 4:
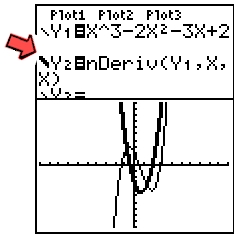
The nDeriv command will appear in
the Y2= entry space, where you
left the cursor.
We will be using the parameters
nDeriv(Y1, X, X)
.
|
Step 5:
Hit GRAPH. |
Step 6:
To more clearly distinguish the derivative graph, set the
graph style to a thicker line (or graph the derivative separately). |