|
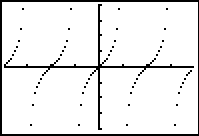
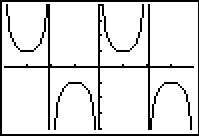
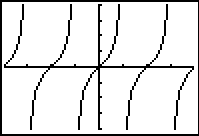
Graphing functions that had undefined x-values, such as various trigonometric functions, on
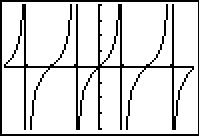
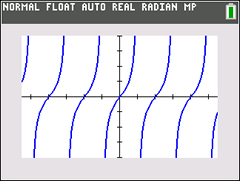
the TI-83+ and TI-84+ (with OS prior to V2.40), would show the appearance of graphed "asymptotes".
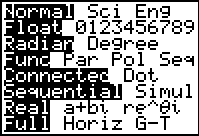
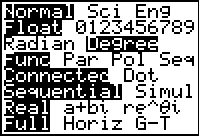
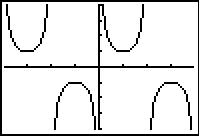
On the Older Models: Let's examine some trigonometric graphs (with undefined values) in Radian MODE:
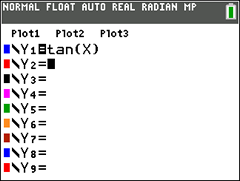
Enter the
function.
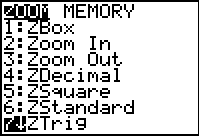
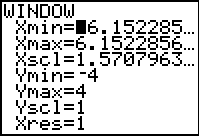
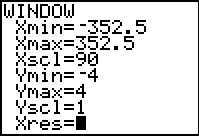
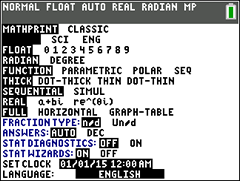
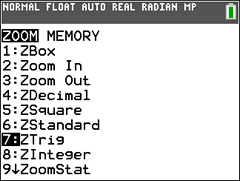
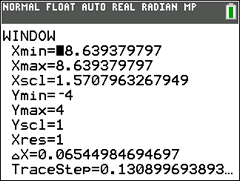
Set the MODE to Radian. Choose ZOOM #7 ZTrig
These appearances of vertical lines were not the asymptotes. They were simply the
calculator behaving as it should in "Connected" mode -- it was
"connecting" the points.
So, why did the calculator not show
"heartbeat" lines in Degree mode?
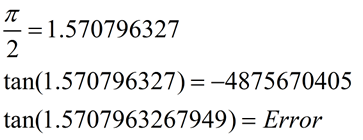
In Radian mode, the calculator is never graphing the undefined points on the
graphs. The decimal approximations for these locations are slightly
"off" -- meaning that the graph is not undefined at these "close"
approximations and consequently points are plotted. When a point is
plotted, the connected mode engages
and connects adjacent points.
In Degree mode,
the calculator attempts to graph the actual undefined points. Such an
attempt produces an "error" and nothing is plotted for those x-values. Consequently, a
break in the graph appears (a non-plotting), preventing the connected mode from connecting adjacent
points, which prevents the creation of the
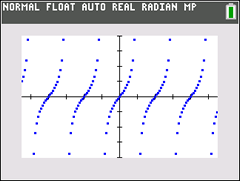
"heartbeat" line, or the "asymptote" illusion. Let's examine the trigonometric graph of tan(x) again in Radian MODE on a newer calculator:
The newer technology has addressed the problem of connected mode plotting points where functions are actually undefined. Consequently, the graphs now appear as they should in connected (thick) mode.
|


